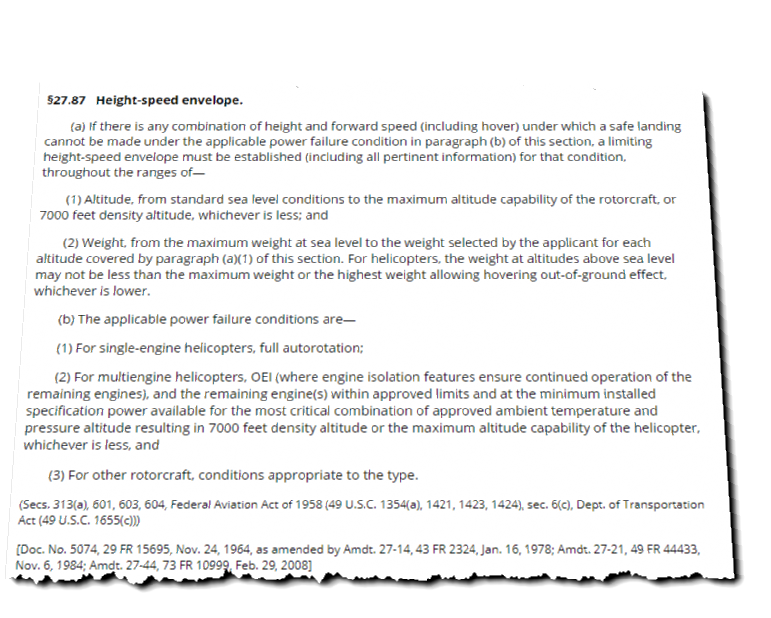
The Height-Velocity Diagram (otherwise known as HV Diagram or Deadman’s Curve) is a performance chart (but a limitation for larger, transport category helicopters) that shows combinations of height and forward speed (including hover) after an engine failure from which a safe landing cannot be made (inside the shaded area). It is part of the certification requirements under FAA Part 27 – Airworthiness Standards: Normal Category Rotorcraft, §27.87 Height-Speed Envelope. But how is the height-velocity diagram determined?
A Misconception
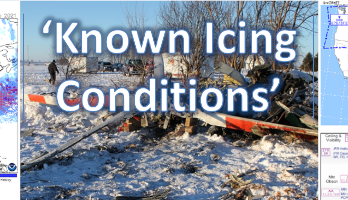
A common misconception is that the HV diagram is based on a highly trained test pilot, who has done the maneuver thousands of times and knows the simulated engine failure is coming, and so an average pilot, should not expect to be able to perform to the limits shown in the HV diagram. Not true. Well, partly not true…
. . . an average pilot, should not expect to be able to perform to the limits shown in the HV diagram. Not true. Well, partly not true…
The Truth
The tests are done by a highly trained test pilot – that only makes sense from a safety point of view. And of course the test pilot knows the simulated failure is coming and they have done this many, many times before. But, the FAA has a couple of stipulations in determining the HV Diagram to make it applicable to a ‘normal‘ pilot.
The FAA has published an Advisory Circular (AC) to provides detailed guidance on how a helicopter is certified under Part 27 – AC 27-1B Certification of Normal Category Rotorcraft which covers many things, including how the HV Diagram is to be determined.
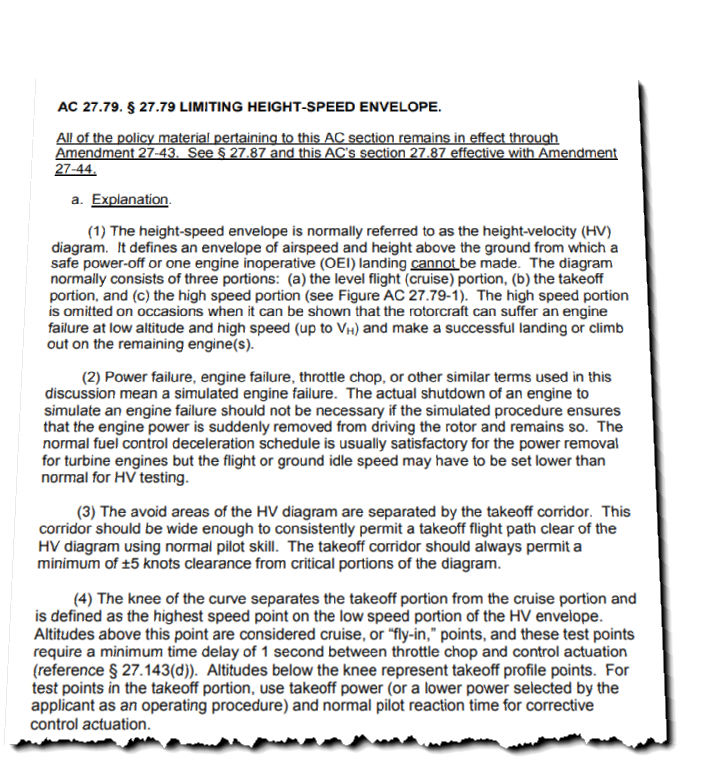
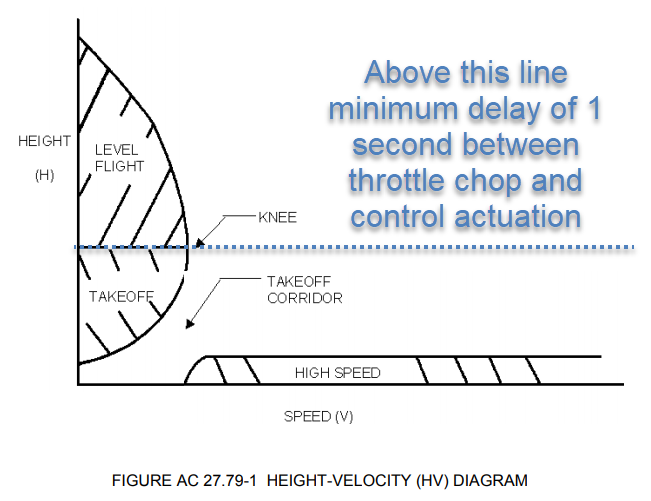
As stated in AC-27-1B, above a certain point (called the ‘knee’ of the chart – see the diagram below), there is mandated minimum delay of 1 second after the throttle chop before the test pilot manipulates the collective. The idea is that above the ‘knee’, it is assumed the helicopter may be in ‘cruise’ phase of flight, where the pilot may not have their hand on the collective (manipulating radios, GPS, etc) and the 1 second delay allows for that. It is assumed the pilot would always have their hand on cyclic and pedals to be able to immediately correct for pitch/yaw. Below the knee, the pilot is assumed to have their hand on the collective, focused on takeoff and ‘primed’ for a possible engine/drive failure and (with “normal pilot reaction time“).
(4) The knee of the curve separates the takeoff portion from the cruise portion and is defined as the highest speed point on the low speed portion of the HV envelope.
Page B-37 AC 27-1B Certification of Normal Category Rotorcraft
Altitudes above this point are considered cruise, or “fly-in,” points, and these test points require a minimum time delay of 1 second between throttle chop and control actuation . . . Altitudes below the knee represent takeoff profile points. For test points in the takeoff portion, use takeoff power (or a lower power selected by the applicant as an operating procedure) and normal pilot reaction time for corrective control actuation.
AC-27-1B also explains that in verifying the HV diagram data, tests requiring “excessive gear loads, exceptional skill requirements . . . damage to the rotorcraft . . . will not be accepted“.
(8) Verifying the HV Diagram.
Page B-41 AC 27-1B Certification of Normal Category Rotorcraft
(i) A sufficient number of test points must be flown to verify the diagram
. . . Test points with excessive gear loads, exceptional skill requirements, winds above permissible levels, rotor droop below approved minimum transient RPM, damage to the rotorcraft, excessive power, incorrect time delay, etc., cannot be accepted.
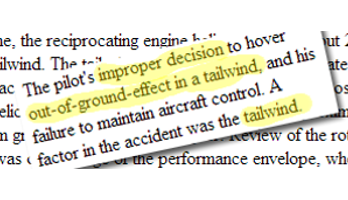
So AC-27-1B states that there is a built-in 1 second delay above the knee and the the autorotation performance should not require exceptional skill or incur any damage to the aircraft, which should give the average pilot hope of being able to safely perform an autorotation just outside the shaded area, but wait – there is still a bit more to it…
Smooth Hard Surface and Ground Run
It is important to note, that as a test pilot determines the boundaries of the HV-diagram, the autorotation is always being performed to a smooth, hard surface, with no limit on the ground run. Think about that for a second… How often are you flying a helicopter within gliding distance of a smooth, hard surface with an unrestricted area for ground run? So, if you are a reasonably proficient pilot with ‘normal’ pilot reactions and you have a smooth, hard surface (to slide the helicopter on after touchdown), then YES, the HV-diagram should represent reasonable accurate performance and outcomes. You just need to keep in mind how things would change if you are distracted (no longer ‘normal’ pilot reaction) and/or flying over terrain that will not allow a safe ground run after touchdown.
Summary
- If the conditions are right (smooth hard surface for a run-on) and your skills are average, the HV Diagram shows reasonable performance expectations of a safe autorotation just outside the shaded areas
- Above the knee there is a 1 second delay in collective manipulation, below the knee ‘normal’ pilot reaction time is expected
- If unable to avoid the shaded areas, be ultra-prepared with heightened sensitivity for problems and have a plan ready to immediately execute
- Keep both your hands and feet on the controls as much as possible and keep forced landing options in mind, especially when flying low or over hostile (trees, houses, rocky terrain, etc)
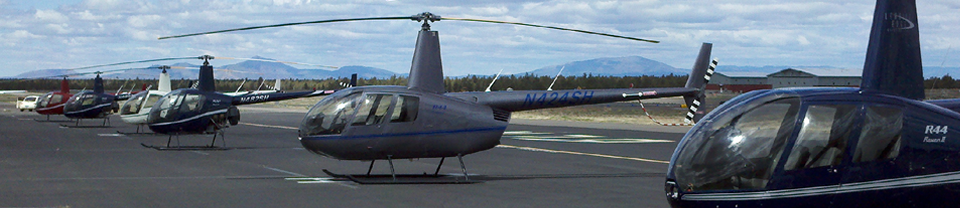
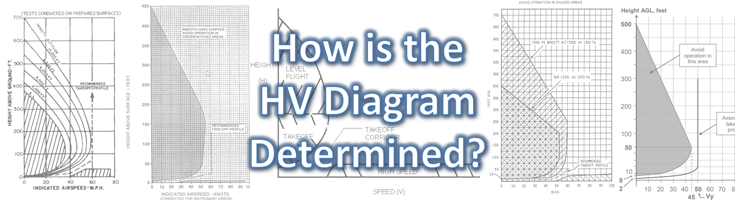
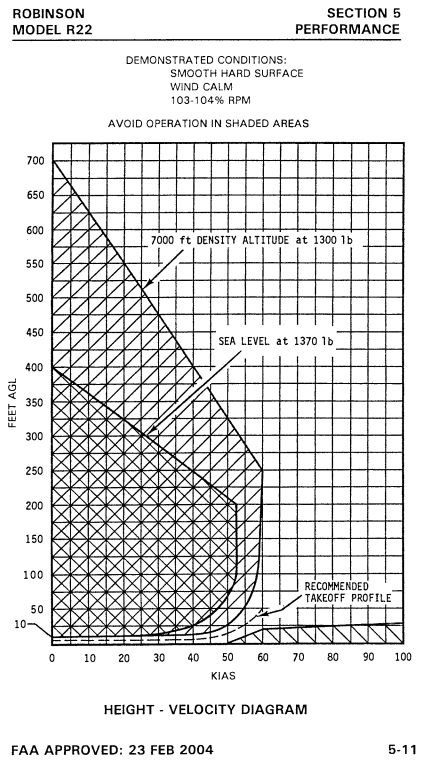
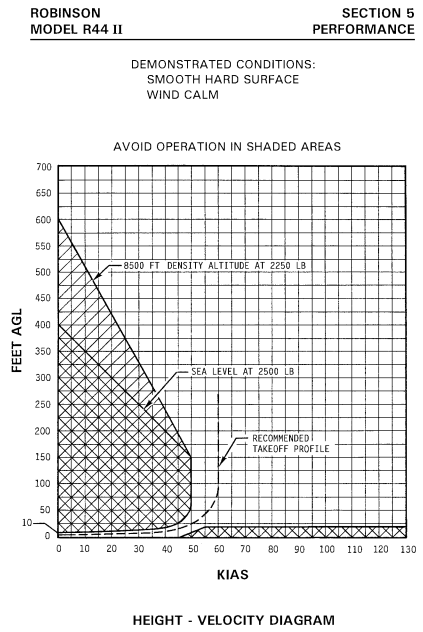
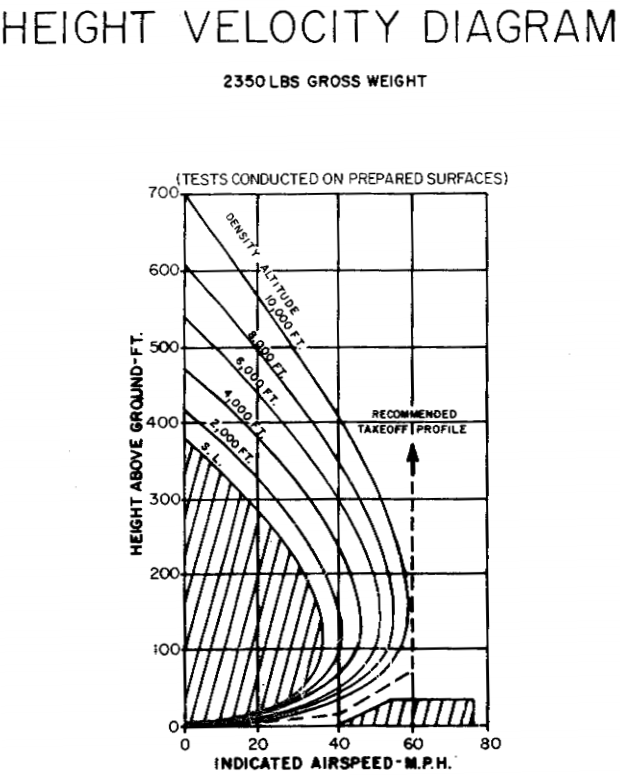
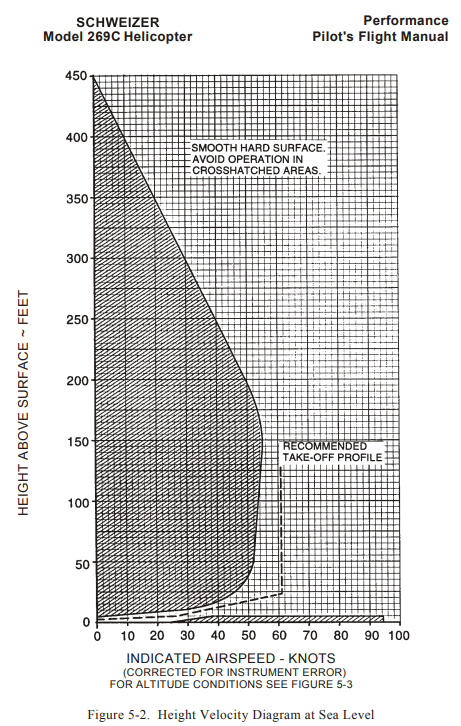
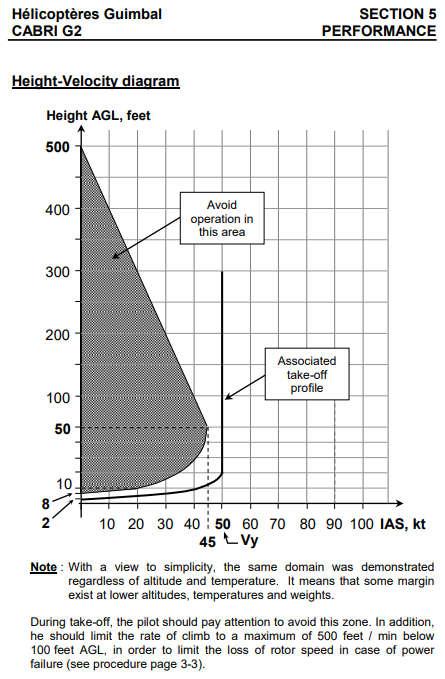
Height Velocity Diagrams of Light Training Helicopters
Just for fun, let’s see how the ‘cruise’ phase of flight on the HV diagrams compares on various light training helicopters (note Enstrom is in MPH, 10 MPH is 8.7 KIAS)… And if anyone wants to buy a Cabri G2 and needs a flight instructor… 😉
More Info
- FAA Part 27 – Airworthiness Standards: Normal Category Rotorcraft, §27.87 Height-Speed Envelope
- FAA Advisory Circular AC 27-1B Certification of Normal Category Rotorcraft
- Pilot Operating Handbooks / Flight Manuals for the R22, R44, 280F, 296C and the Cabri G2
- Listen to Shawn Coyle (Little Book of Autorotations and Cyclic and Collective) talk about the Height Velocity Diagram on The Rotary Wing Show Podcast
Feedback
Did this help? Do you have any corrections or suggestions? Use the comments form below, and thanks for your feedback.